Abstract
Modern computing systems act as black boxes in that they accept inputs and generate outputs but provide little to no visibility of their internal workings. This greatly limits the potential to understand cyber behaviors at the level of detail necessary
to detect and counter some of the most important types of cyber threats. The motivation of this project is to design a visualization solution for a real-world problem domain in field of computer security where the various
system level process and thread level activities involves.
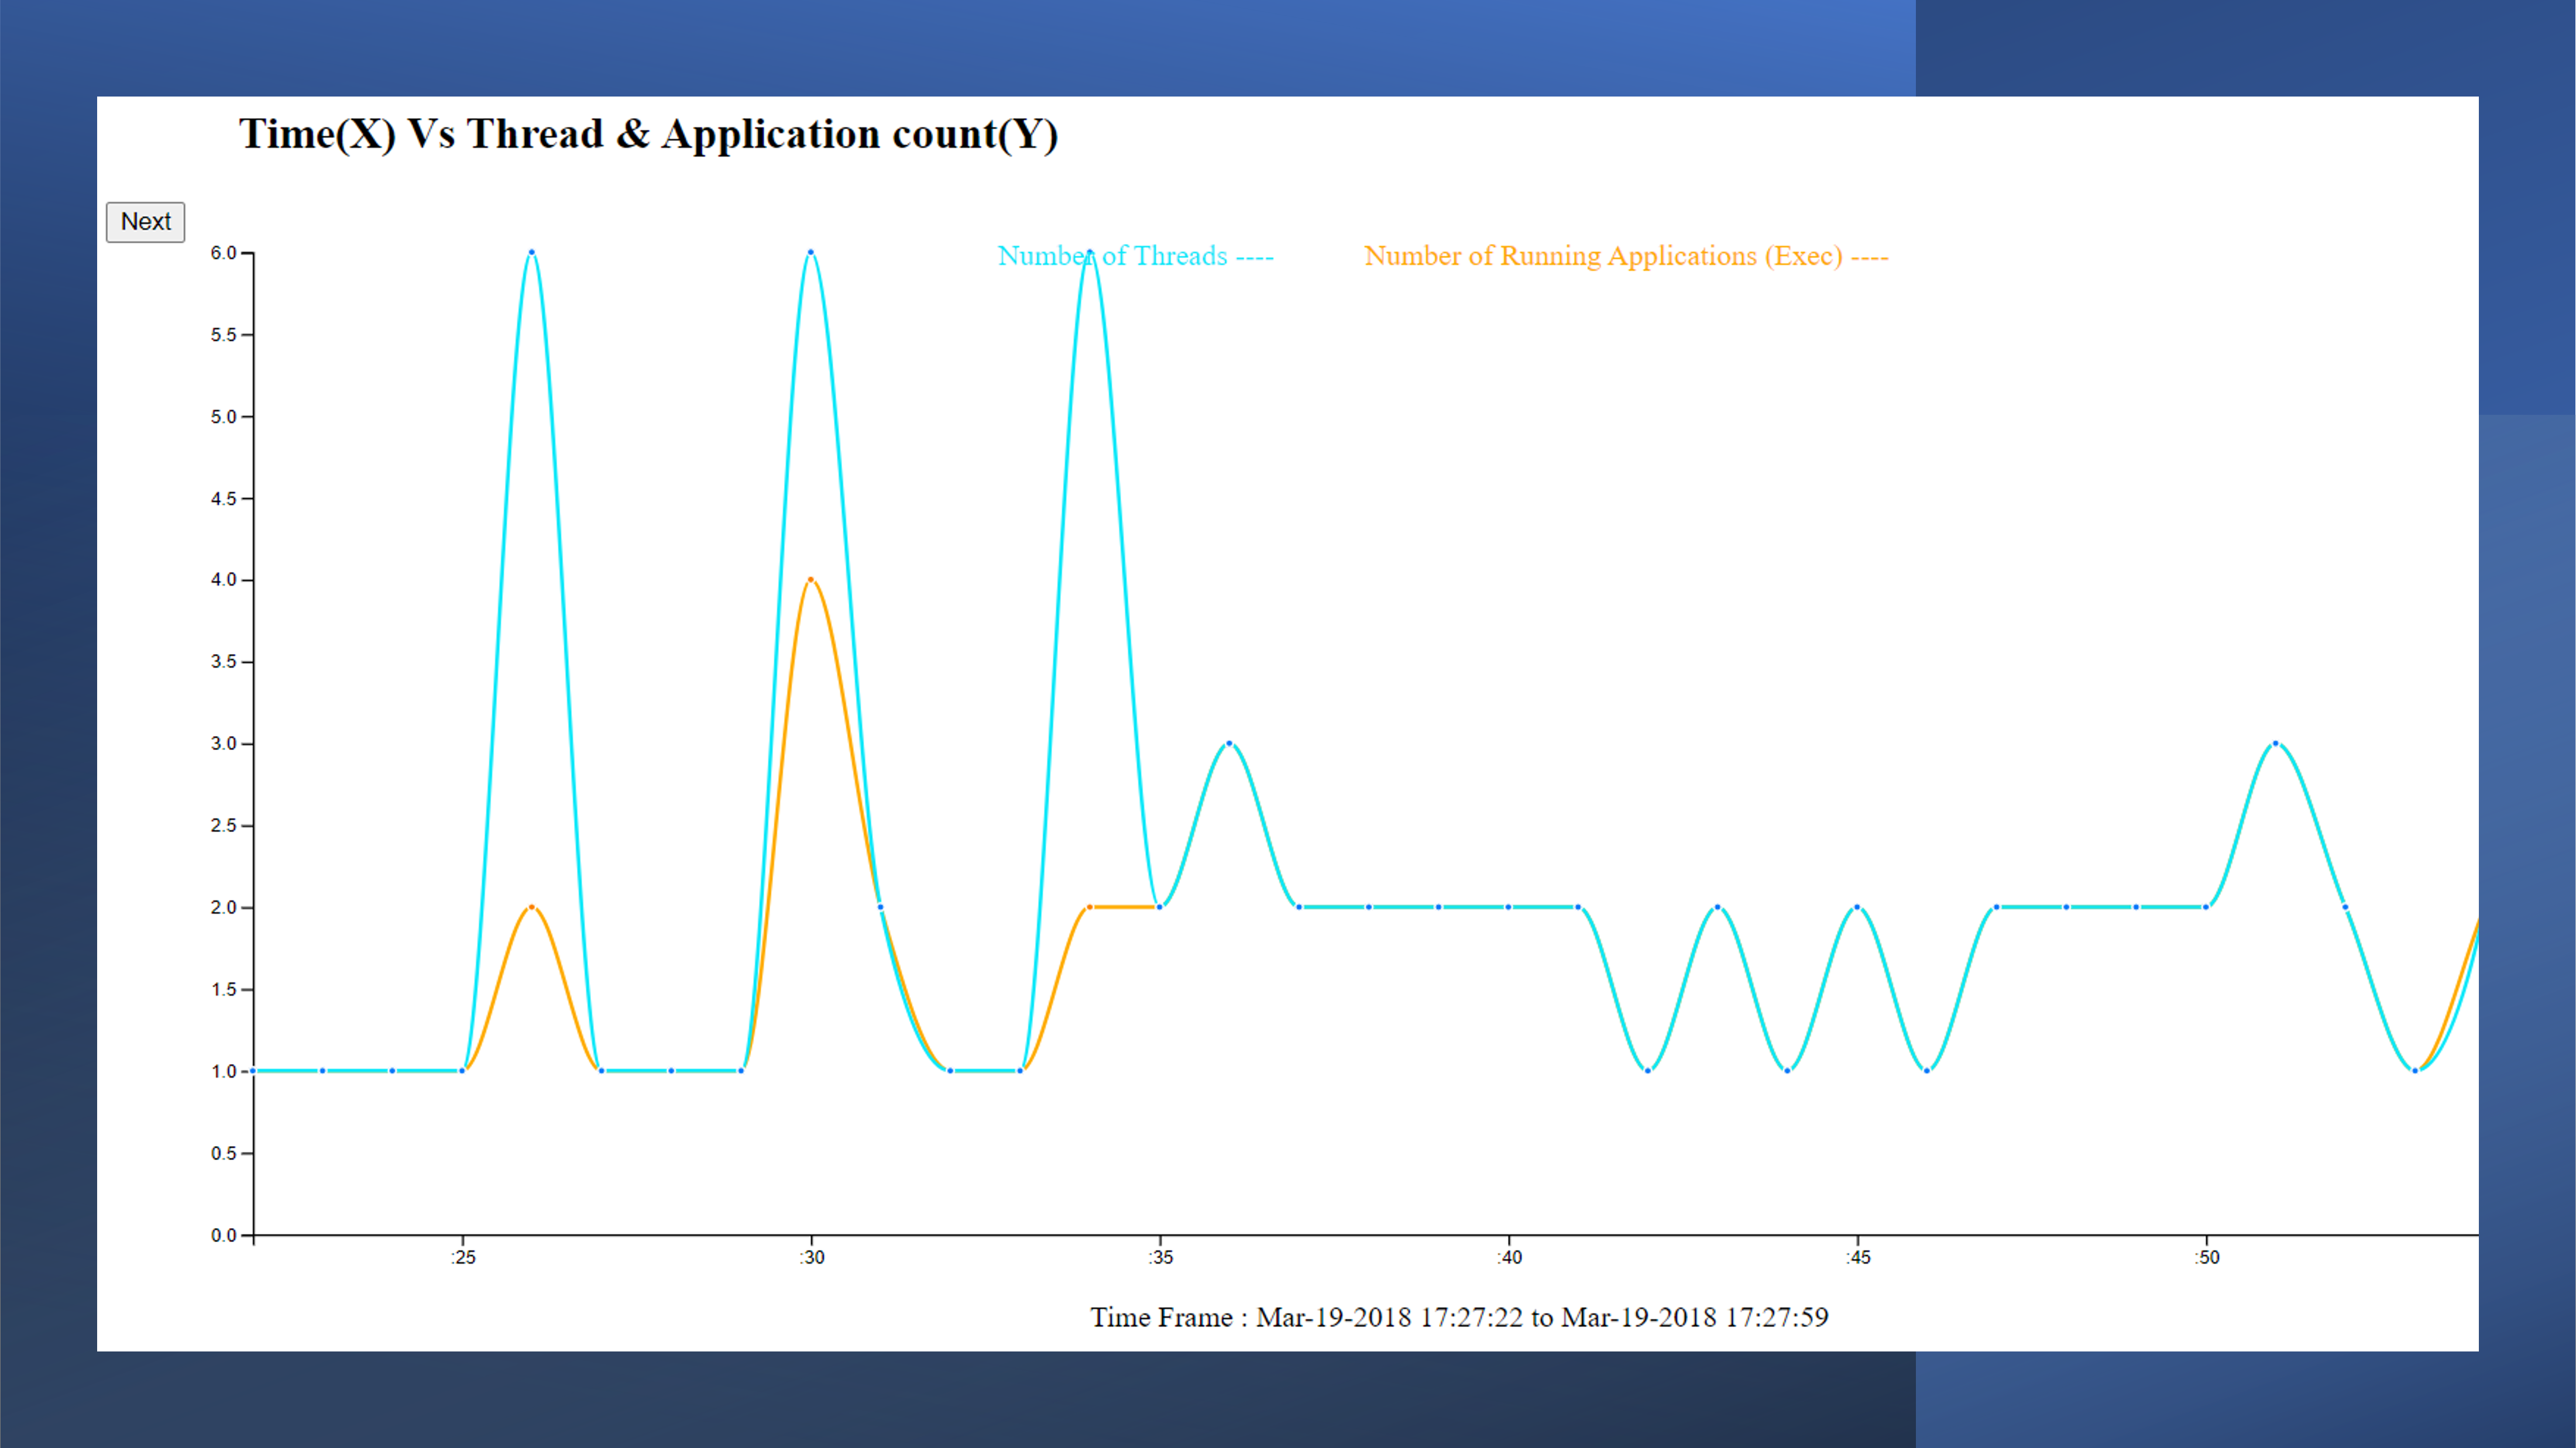
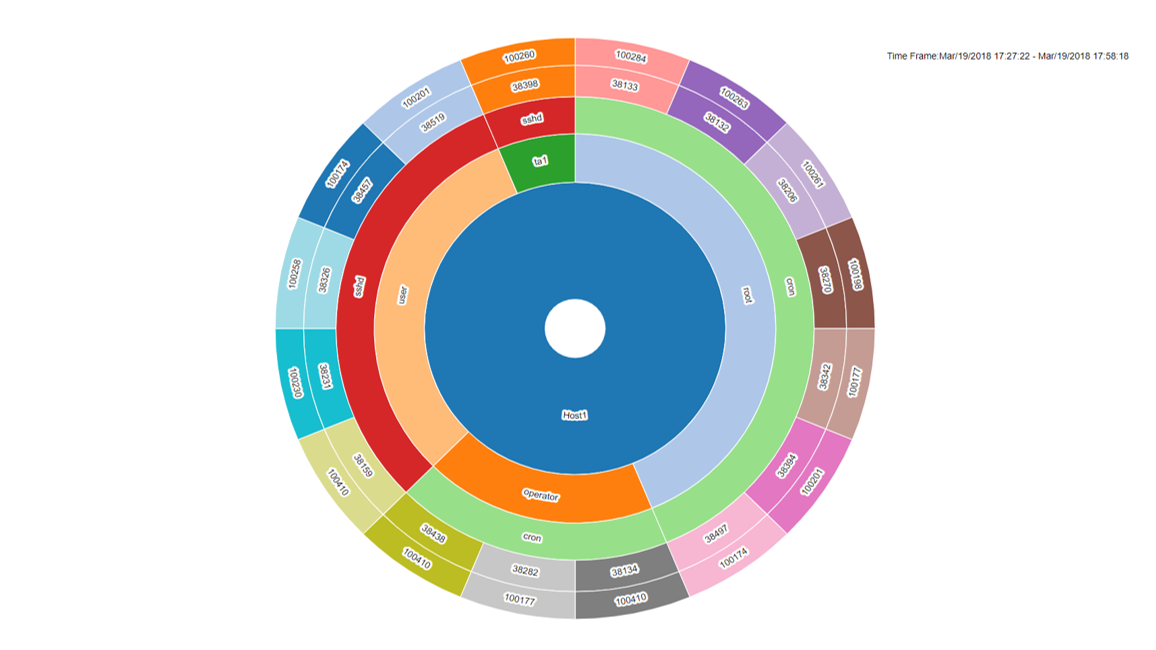
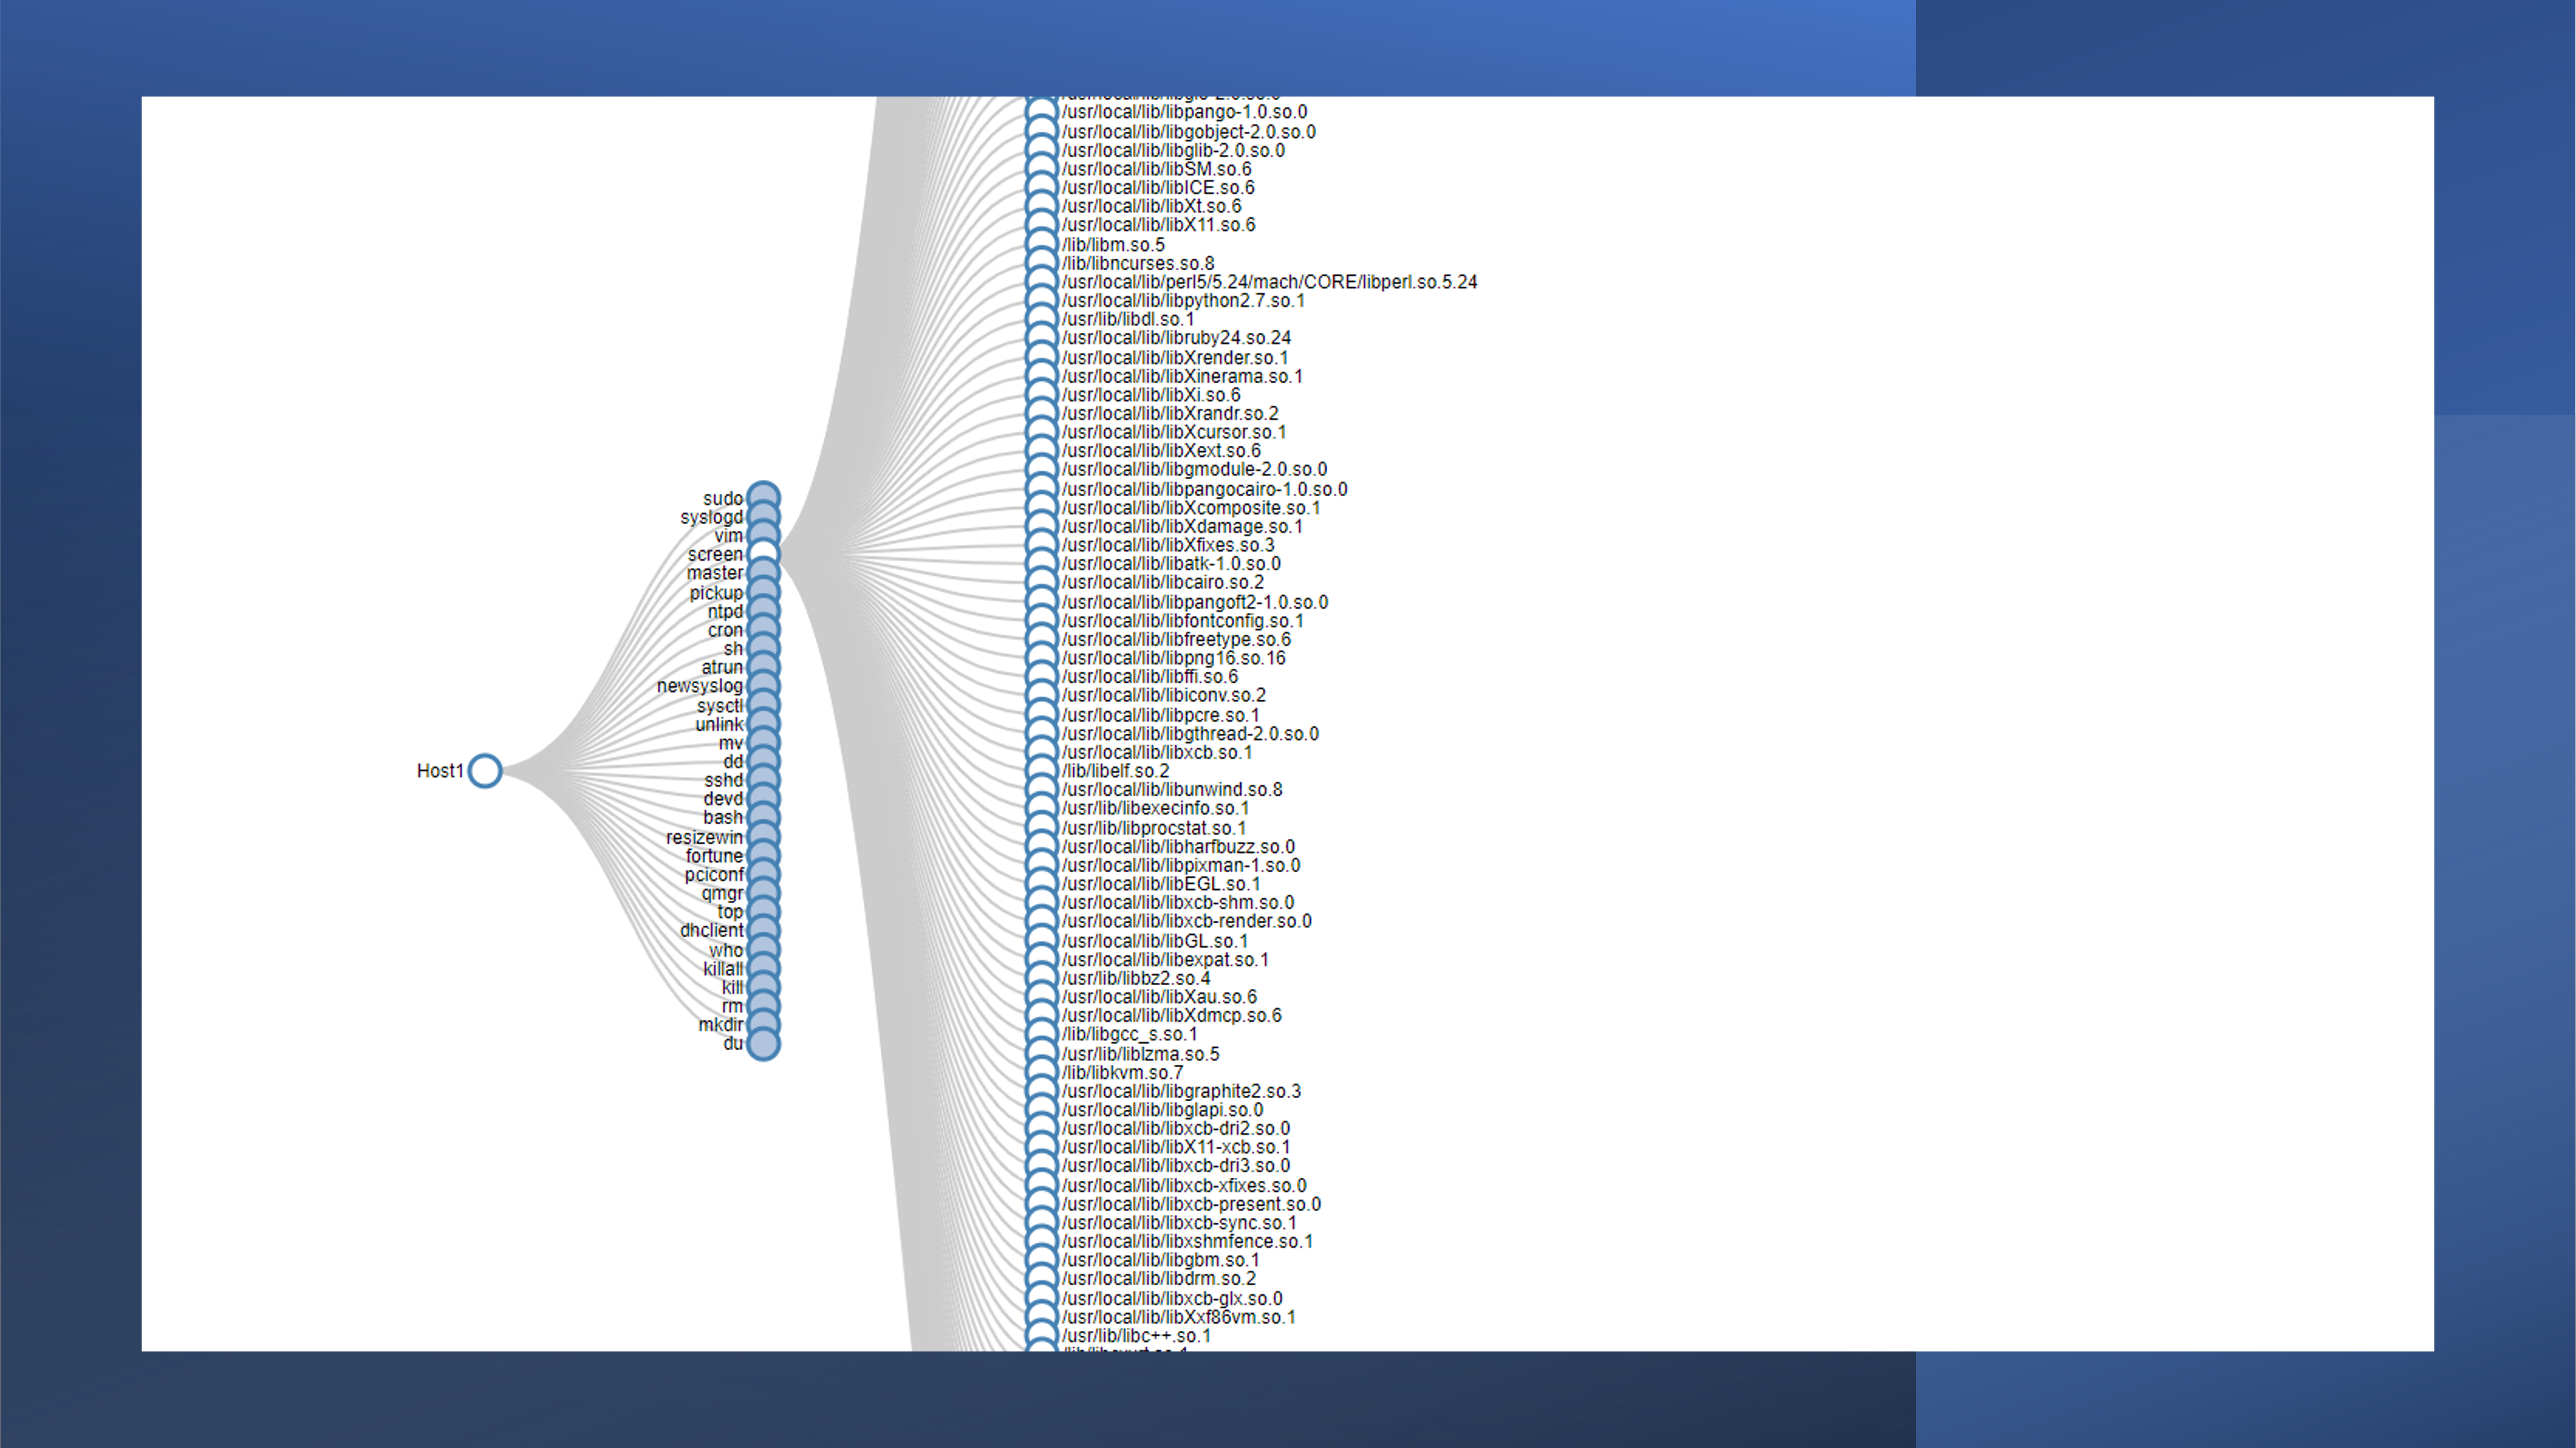
The main goal is to process the large set of data and to make it able to visualize it in most convenient way, so that the user/audience can take decision in the event of suspicious behaviors. In terms of technologies, D3 library was used in JavaScript
in html template to launch the visualization models as a webpage. The data files were uploaded in GitHub to avoid the CORES header issue while loading datafile from local machine. So, the script will load the data directly
from GitHub via internet.


